Reimagining the Commonwealth Continuum Revolutionising Commonwealth Trade
Commonwealth Trade and COVID-19
Pre-Pandemic Commonwealth Global Trade
Impressive performance by the Commonwealth states in 2017-2018 saw a year-on-year trade growth rate of 10 per cent, which then faltered in the face of the global trade contraction in the wake of the China-US trade dispute that began in 2018. This led to a global contraction in product trade by 3 per cent in 2019 and cut the Commonwealth global export growth to 0.4 per cent.
Commonwealth trade volume and trends
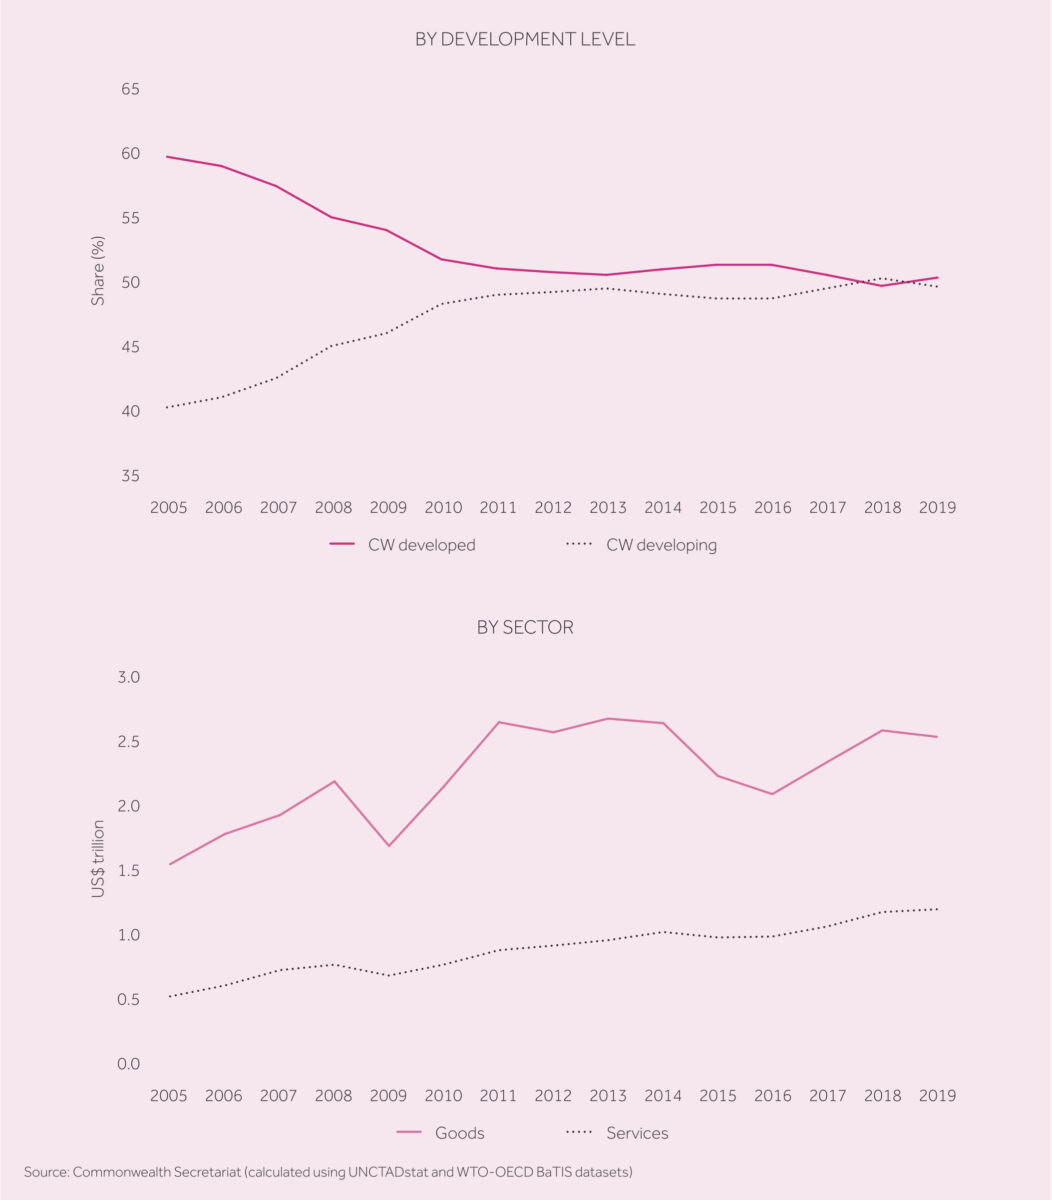
Preceding the start of the pandemic in late 2019, the Commonwealth’s goods and services exports for the year were US$3.73 trillion, a 77% increase compared to the 2005 sum of US$2.1 trillion. The exports of developing countries comprise half of this 2019 total with a greater contribution in goods’ exports than that of the developed countries. Despite this upward trend, the Commonwealth share in global exports decreased by 1.1 per cent during the same timeline due to the rising share in global exports of China and other large developing countries outside the Commonwealth. This decrease was partially negated by the positive growth in intra-Commonwealth trade’s share of member countries’ global trade from 16 per cent to over 18 per cent between 2005 and 2019. Before the economic downturn due to the pre-pandemic factors which began in mid-2018, the total exports share trend of the 48 developing member countries intersected with that of the 6 developed member countries (Australia, Canada, Cyprus, Malta, New Zealand and the UK) [Figure 1]. The developing countries have gradually increased export shares from 40 per cent in 2015 to 50 per cent in 2017, of which goods’ exports rose from 42 per cent in 2005 to 51 per cent in 2019, and services rose from 31 per cent to 47 per cent in the same duration.
Analysts assessing these trends highlight Asian developing countries, most notably India and Singapore, to be the drivers of this increase as the region more than doubled their export values to a whopping US$1.51 trillion in 2019 translating to 41 per cent of total Commonwealth trade as compared to 31 per cent (US$635 billion) in 2005. Although not at par in export value to the Asian region and only increasing their share in total trade by 0.1 per cent (from 0.3 per cent to 0.4 per cent) during the 14-year time frame, the Pacific small island developing states (SIDS) overtook the Asian region in terms of exports growth, multiplying their 2005 export value times three in 2019 to US$15.9 billion. The thirty-two small states of the Commonwealth combined amounted to US$115 billion in global exports and US$33 billion to intra-Commonwealth exports in 2019, contributing a share of 0.45 to global exports and 3 per cent to Commonwealth exports. Malta and Cyprus led these exports making up one-third of the region’s exports at a value of US$37 billion followed by the developing countries Papua New Guinea (US$11.6 billion), Brunei Darussalam (US$7.6 billion) and Jamaica (US$6 billion). Commonwealth small states have already been facing challenges in increasing their trade levels because of their size, geographical distance from mainstream trade routes, lack of diversity in production sectors, lack of infrastructure to protect against natural disasters that have worsened over the years due to climate change, and inadequate policies for challenges faced by their fishing and tourism industries. In this vulnerable position, the small state members were further affected by pre-pandemic influences, causing them a loss of US$1 billion to their 2019 exports.
Figure 1: Evolution of Commonwealth Members Exports, by Development Level and Sector, 2005-2019
Commonwealth global trade structure
68 per cent of the bloc’s trade is in merchandise/goods amounting to US$2.5 trillion while services made up the remaining US$1.2 trillion. Overall in 2019, the UK ranked number one in terms of both goods and services exports contributing an overall of 24 per cent, 19 per cent (US$468 million) in goods and 35 per cent (US$416 billion) in services. Alongside the UK, India, Singapore, Canada, Australia, Malaysia, South Africa, Nigeria, New Zealand and Bangladesh are the ten countries that represented 94 per cent of goods exports; the UK, India, Singapore, Canada, Australia, Malaysia, South Africa, New Zealand, Malta and Cyprus represented 93 per cent of services exports. As can be seen, the majority of Commonwealth trade is concentrated in less than one-fifth of the bloc’s members and when their economies declined due to the pandemic in 2020 it disrupted the entire Commonwealth’s internal and external trade flows, and economic recovery for the bloc will depend heavily on the recovery of these select economies.
Among Commonwealth nations, the developing countries exported the majority of the trade merchandise (US$1.8 trillion out of the US$2.5 trillion total) in 2019; however, as mentioned previously these export shares are concentrated in a handful of the 48 members. Commonwealth Asia is the leading region for goods exports accounting for 80.8 per cent (US$1.03 trillion); of this region, three Asian countries provided 40 per cent of this value, 16 per cent from Singapore (US$390 billion), 13 per cent from India (US$323 billion), and 9 per cent from Malaysia (US$238 billion). Within Commonwealth Africa the three sub-Saharan African (SSA) countries of South Africa, Nigeria and Ghana accounted for 41 per cent (US$90 billion), 29 per cent (US$65 billion), and 8 per cent (US$16 billion) respectively. Of all the categories of Commonwealth states, the Pacific SIDS are the most reliant on merchandise exports as it makes up 82 per cent of their total exports. In 2019, Papua New Guinea dominated goods trade making up approx. 90 per cent (US$11.4 billion) of the region’s imports, followed by Fiji that contributed one-tenth of the same amount. Two-thirds of the Caribbean SIDS exports in goods came from Trinidad and Tobago (US$ billion), Guyana (US$1.7 billion) and Jamaica (US$1.6) accounted for most of the remaining exports.
The Commonwealth’s services exports to GDP shares are above the world average across all regions and the travel, transport, ICT and financial sectors made up 60 per cent of all Commonwealth services exports; yet, similar to the merchandise trade, the value of exports vary widely amongst the different countries. The developed countries provided 53 per cent in value to the Commonwealth’s services exports in 2019 (US$634 billion) of which the UK provided 35 per cent (US$222 billion). The developed countries’ share has been decreasing gradually since 2005 wherein their share was 69 per cent which can be explained by the increase of services exports in developing countries, especially Singapore and India in Asia which combined also made up one-third of the services exports, mainly via IT and business services. The Caribbean SIDS are the most service-oriented region of the bloc as they make up 54 per cent of the region’s total exports mainly due to their heavy reliance on tourism; similar to these Caribbean member states, the Pacific region also garner a sizeable portion of their GDP (39 per cent) from tourism and travel services. On the other hand, Commonwealth Africa’s services exports represented 19 per cent of the region’s total exports in 2019 of which South Africa, Ghana and Kenya combined accounted for 57 per cent of the entire region’s services exports; only two SSA countries, namely Mauritius and Seychelles, exported more services than goods worth US$2.9 billion and US$1.1 billion respectively, with more than 50 per cent of their exports due to their travel and tourism sectors.
Pre-pandemic intra-Commonwealth Trade
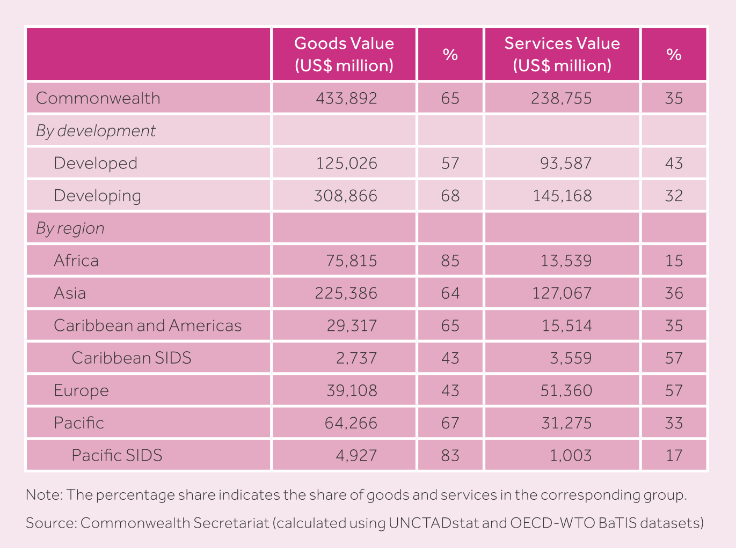
Figure 2: Share of Goods and Services in Intra-Commonwealth Exports, 2019
Intra-Commonwealth trade volume and trends
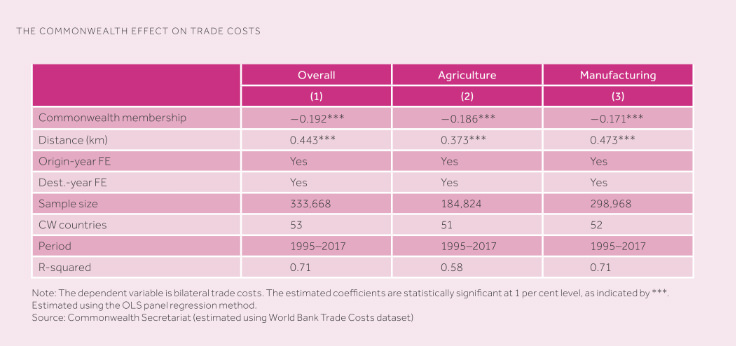
Intra-Commonwealth trade’s share in member’s total trade flows [Figure 2] has been steadily rising since 2005, peaking at a level of 19.3 per cent in 2012 after which the global trade slowdown of 2012-2015 halted the upward trend, leaving it at a plateaued rate of 18 per cent till 2018-2019. Small states, LDCs, and SSA countries are particularly reliant on intra-Commonwealth trade as they have benefited from what has been dubbed the “Commonwealth Advantage” [Figure 3] which refers to the 21 per cent (on average) lower trade costs between Commonwealth countries’ pairs as opposed to trading with non-Commonwealth countries; this advantage applies to all primary and manufactured products although the effect may be slightly stronger for some sectors than others. The advantage arises from commonalities in legal and administrative systems, the use of English in foreign relations, and a large diaspora with massive untapped potential for trade growth. The most interesting aspect of this advantage is the fact that it is still growing as trade costs between member countries continue to lower and the share of intra-Commonwealth trade in member countries’ total trade continues to increase. Due to its benefits, analysts argue that it must be capitalised upon to accelerate post-pandemic economic recovery.
Figure 3: The Commonwealth Effect on Trade Costs
In 2019, intra-Commonwealth trade reached US$672 billion reflecting the member countries’ global trading trends; merchandise made up two-thirds (US$434 billion) of total intra-Commonwealth trade lead by developing member states that exported 2.5 times more than their developed counterparts. In terms of total intra-Commonwealth services exports in 2019 (US$239 billion), developed member states contributed a larger share (43 per cent). Merchandise trade flows between members has steadily surged from US$240 billion to US$433 billion in 2019, whilst intra-Commonwealth service flows more than doubled from US$98 billion to US$238 billion within the same period. Similar to global trends, the developing members are leading intra-Commonwealth trade, having increased their share of total exports from 60 per cent in 2005 to 67 per cent in 2019 and the value of exports has increased over two-fold from US$204 billion to US$450 billion in the same period. Commonwealth Asia’s developing countries are the main factor for this increase. Meanwhile, the developed countries’ total exports share of 40 per cent in 2005 decreased by 7 per cent over these 14 years. Of this share, few developed countries dominate trade flows. The UK on its own made up 40 per cent of the developed countries’ intra-bloc trade flows leading in services (46 per cent) and Australia dominated merchandise trade shares (39 per cent).
Overall, the trade flows within the Commonwealth have considerably evolved thanks to the members’ initiative to expand their trade avenues and fortify trade linkages amongst each other; as a result, between 2005-2019, 24 member countries have gained more shares in intra-Commonwealth trade e.g. Vanuatu’s share went from 15 per cent to 50 per cent because of increased trade with fellow members Australia, New Zealand, Singapore, Fiji, and Malaysia.
Reliance of Commonwealth small states and LDCs on intra-bloc trade
Small states are the most dependent on intra-Commonwealth trade, having a 31 per cent share of merchandise trade and 26 per cent share of services trade which makes up 28 per cent of their global trade. There is wide variation in contribution among the 32 small states; between 2017-2019, the share of intra-Commonwealth exports in Kiribati’s exports was 6 per cent whereas for Eswatini it was 80 per cent. As for imports, small states like The Bahamas’ only had 10 per cent of their global imports from intra-Commonwealth trade flows but other small states like Eswatini imported 80 per cent of their total from fellow member states. The 14 LDCs of the Commonwealth also have a significant portion of their trade coming from the intra-bloc flows; the 9 SSA countries made up 50.5 per cent (US$9.6 billion) of the LDC’s intra-bloc trade but the top exporter of the region was Bangladesh contributing 48 per cent on its own (US$9.1 billion).
The intra-bloc trade of the African LDCs takes place predominantly within the region e.g. almost 30 per cent of Zambia’s, Mozambique’s, Tanzania’s and Uganda’s intra-bloc exports go to other African countries. The composition of their intra-bloc trade is similar to their global exports meaning though their merchandise trade is higher in value the share of services is higher in their exports. The Trade Review states that intra-Commonwealth trade is three times more likely to occur in a region wherein there are existing trade agreements which is evident in the intra-Commonwealth imports of the African LDCs being sourced almost entirely from within the region due to existing trade linkages such as the South African Customs Union (SACU), Caribbean Community (CARICOM), and the Organisation of Eastern Caribbean States (OECS) amongst others.
Regional distribution of intra-Commonwealth trade
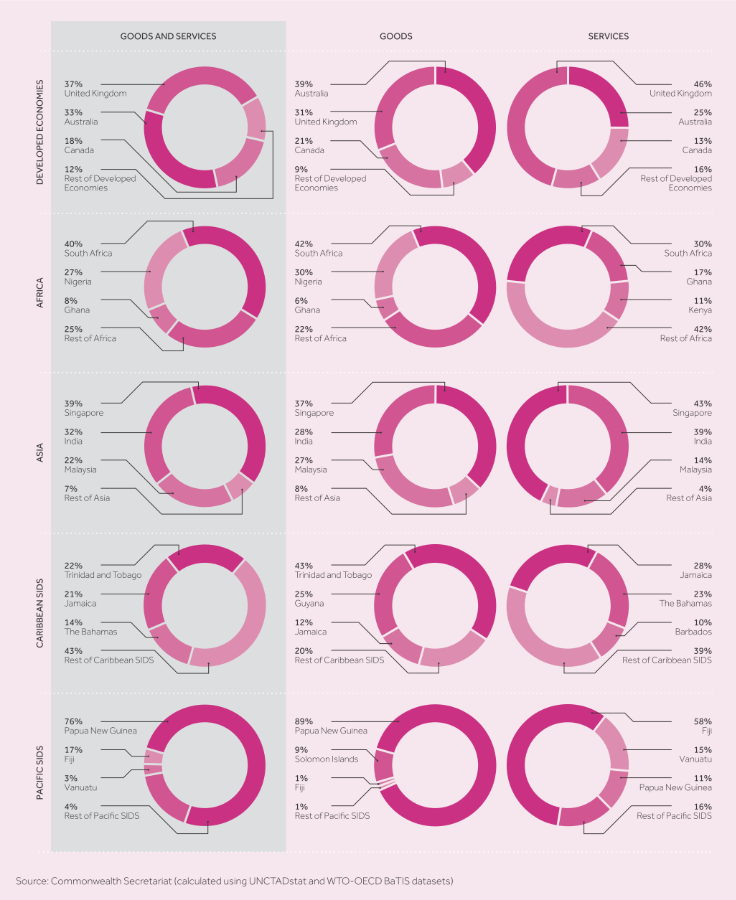
Analysing the trends of intra-Commonwealth distribution and regional structure in 2019, Commonwealth Asia was found to be the dominant supplier of intra-Commonwealth trade increasing its share by 4 per cent from 2010 to 52.5 per cent. In merchandise trade, the Asian region contributed 52 per cent of total intra-Commonwealth merchandise exports, 92.1 per cent of which came from Singapore (36.7 per cent), India (28.3 per cent) and Malaysia (27.1 per cent). India, Singapore, Malaysia and Bangladesh imported 36 per cent of total intra-bloc merchandise imports in 2019. Commonwealth Asia has also been leading the developing countries (60 per cent) share of intra-Commonwealth services exports accounting for 53 per cent of total intra-bloc services exports. Similar to merchandise exports, Singapore (43 per cent), India (39 per cent) and Malaysia (14 per cent) lead these exports, and India also was the lead importer of services exports. Between 2010 and 2019, the developed economies increased intra-Commonwealth trade in terms of value but their intra-Commonwealth trade shares have declined marginally. Nonetheless, they remain influential in their respective regions; Australia and New Zealand drive Pacific intra-bloc trade while Canada remains the lead exporter in the Caribbean and Americas region. For merchandise trade, the developed countries constituted 29 per cent of total intra-bloc goods trade lead by Australia (39 per cent), the UK (31 per cent) and Canada (21 per cent). For services trade, the majority of these economies were present in the Top 10 ranks with the UK as the second-largest exporter and third-largest importer overall for intra-bloc trade services trade and Australia ranking fourth for both imports and exports.
In the case of Commonwealth Africa over 75 per cent of the region’s exports (US$89 billion) originated from South Africa, Nigeria, and Ghana with South Africa being the largest exporter of both merchandise (42 per cent) and services exports (30 per cent); the following ranked countries in merchandise were Nigeria (30 per cent) and Ghana (6 per cent), and for services Ghana (17 per cent) and Kenya (11 per cent). The Caribbean region has increased exports in value (US$6.3 billion) but has declined in terms of intra-bloc export shares. The three economies of Trinidad and Tobago, Jamaica and The Bahamas accounted for 57 per cent of total exports; Trinidad and Tobago lead merchandise trade (47 per cent), followed by Guyana (24.6 per cent) and Jamaica (11.5 per cent) meanwhile for service trade, the top exporting countries were Jamaica (28.3 per cent), The Bahamas (22 per cent), and Barbados (10.4 per cent). The Pacific SIDS’ intra-Commonwealth exports are concentrated in two member states; Papua New Guinea represented 90 per cent of the merchandise trade whilst Fiji represented 60 per cent of the services trade. Interestingly, despite the heavy concentration of the region’s services exports in one country, the Pacific SIDS had a higher share in the intra-Commonwealth service trade than the African and Caribbean member states’ shares summed up. [Figure 4]
Figure 4: Share of Goods and Services Exports for Leading Exporters, by Region, 2019
Servicification within Commonwealth trade
Between 2005 and 2019, intra-Commonwealth services trade increased by 6.88 per cent, slightly higher than the 6.38 per cent global increase in services trade as well as the Commonwealth’s global export trade growth of 6.45 per cent. Aside from the Commonwealth trade advantage and the expansion of services trade of notable developing countries Singapore and Malaysia, “servicification” has been influential in this increase of services trade. Servicification is a two-pronged phenomenon whereby on one hand an increase in per capita income of a population shifts their consumption preferences to services, leading to an increase in the demand for services production. This is compounded by technological advancements as increasing levels of activities within the manufacturing sector are becoming services. This trend is evident in both developed and developing Commonwealth states, but is faster in the case of the latter.
Impact of COVID-19 on Commonwealth Trade
Figure 5: Impact of the COVID-19 Pandemic on Commonwealth Countries Global Exports in 2020
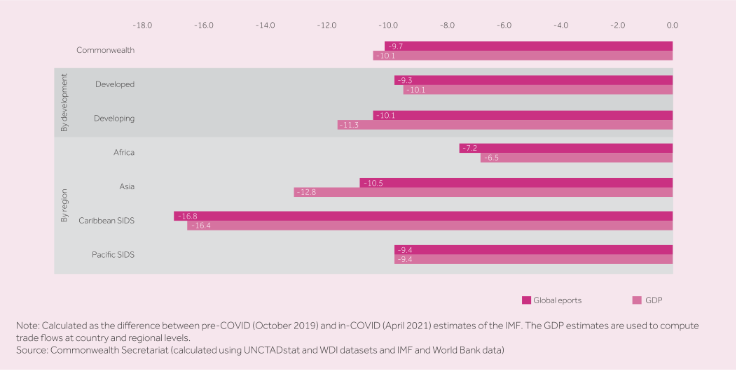
Based on the pre-pandemic trade growth trends, in 2020 the Commonwealth economies shrank 10 per cent with a loss of US$345 billion in trade flows that were estimated at US$3.55 trillion (estimates taken from October 2019 pre-COVID levels to April 2021 during-COVID levels). The drop in trade flows has been varied across the Commonwealth regions based on their infrastructure and varied development levels across sectors that have been most affected by the pandemic [Figure 5]. The developing countries’ average drop in global exports of 10.1 per cent was 0.8 per cent higher than the developed countries; causes for this above-average decrease can be attributed to inadequate economic relief and support for businesses affected by the pandemic but more importantly due to the devastated export markets of advanced economies.
The EU-27 and the United States together account for 75 per cent of the developed members’ exports and half of the developing counterparts’ and when both these economies’ GDP contracted by 3.5 per cent and 6.6 per cent respectively and because of the long-term effects of the pandemic as well as the ongoing economic recession, the Commonwealth countries may feel the direct and indirect ‘knock-on’ effects for years to come. Across the regions, Asia registered the sharpest drop in exports value (US$146 billion or 9.6 per cent), following that was Africa (US$20 billion or 7.3 per cent), the Caribbean (US$4.2 billion or 14.2 per cent), and the Pacific (US$1.3 billion or 8.1 per cent); as the data portrays, even though the Caribbean and Pacific states had a lesser decline in value their economies contracted the most, especially Caribbean SIDS states that faced a 20 per cent decline. The reasoning behind the greater decline for SIDS is due to their dependency on services exports in travel and tourism sectors that were particularly hard-hit by pandemic containment measures. Intra-Commonwealth trade fell to US$641 billion as compared to the US$701 projection for 2020 for which the regional export decline trends match with the global trends mentioned by the previous paragraph; Asian exports fell by US$36 billion (10 per cent), African exports by US$6.5 billion (6.6 per cent), Caribbean exports by US$4.2 billion (8.4 per cent) and Pacific exports by US$5 billion (5 per cent); similar to global trends, the Caribbean states’ and Caribbean SIDS’ (16 per cent decrease) relative exports declined more sharply than other member regions.
COVID-19’s effect on Commonwealth merchandise trade
Although the pandemic’s ramifications for merchandise trade began to be felt as early as January 2020, the sharpest drop in exports occurred in April-May 2020 as it was at this point the major export markets of the Commonwealth in Europe and the US began to impose strict lockdown measures; during these two months, the Commonwealth global exports were halved while intra-Commonwealth exports fell even lower. The containment measures implemented due to the pandemic, i.e. social distancing and quarantines, created uncertainty in market performance, due to which demand for goods and services plummeted causing shocks to global value chains (GVCs) that travelled upwards to supplier countries. For example, garment manufacturing Commonwealth countries, especially Bangladesh and Lesotho, were first impacted on the supply-side due to the delays in the transport of up to 60 per cent of all raw fabric imports which came from China, and then closure of clothing retail stores in the major markets of the US and Europe further worsened the impact on Commonwealth garment suppliers. Asian garment-producing countries saw their garment exports fall by 70 per cent; Bangladesh faced a loss of US$1.5 billion and 1 million workers of the industry were laid off as more than half of the garment manufacturing businesses surveyed online by the Commonwealth Secretariat reported cancellation of the majority of their orders, and those workers that managed to stay employed had their salaries cut by 21 per cent. Furthermore, a directly proportional relationship between the number of COVID cases plus austerity of lockdown measures and decline in trade flows was found via regression analysis whereby a 10 per cent increase of infections led to a 0.33 per cent decline in exports for Commonwealth countries. This analysis explains why the five Commonwealth countries of Canada, India, Pakistan, South Africa and the UK (that collectively account for 60 per cent of the bloc’s global exports and 40 per cent of intra-bloc exports) recorded a trade decline of over 10 per cent as these countries had a relatively higher number of infections.
Globally, commodities make up one-third of total merchandise trade 20 per cent of which are exported by Commonwealth countries which accounts for 45 per cent of total Commonwealth merchandise trade; the importance of these commodity exports cannot be overstated for the 31 member states that derive over 80 per cent of their merchandise trade revenue from these items. Commonwealth commodity exports mainly consist of fuels (42 per cent), mineral ores (36 per cent) and agri-food products (22 per cent), and in 2020 55 per cent of these commodities were destined for China, the US, EU-27, the UK and Australia. COVID-19 collapsed these commodities’ prices causing an overall loss of US$125 billion or 24 per cent of pre-pandemic values; the most affected commodities by price were minerals, ores, metals, and fuels while agricultural products (both raw and processed) remained relatively unaffected. In terms of export destinations, the bloc’s exports to the US were the most afflicted (US$50 billion loss), followed by the EU-27 (US$41 billion loss) and China (US$26 billion) that also decreased commodity imports from Australia due to the latter’s diplomatic differences with Beijing.
Fortunately, trade loss due to dip in prices was partially cushioned by commodity price recovery in the second half of 2020; resumption of travels increased fuel price (US$66/barrel) and the burgeoning trend of electric and hybrid vehicles is not only replenishing demand for minerals but could potentially create a ‘super-cycle’ that may result in trade recovery for the commodity faster than expected. As for overall merchandise trade recovery, this review finds that in conjunction with the easing of lockdown measures and travel restrictions around June 2020 and with the adjustment of firms to the quarantine systems via the use of digital platforms to conduct business, merchandise exports began recovering; however pre-pandemic values have yet to be reached and will require more time and concerted efforts via policy re-adjustments.
COVID-19’s effect on Commonwealth services trade
No less than half of Commonwealth member states’ GDP arises from services. Services also contribute a share of 35 per cent to intra-Commonwealth trade, much higher than the global average of 25 per cent; for high-income countries and SIDS of the Commonwealth that are most reliant on tourism, travel and finance services the share of services in GDP is even higher e.g. Malta, Nigeria, Antigua and Barbuda all have above 90 per cent shares of services in their GDP. The travel and transport industry accounts for half of these Commonwealth services exports which is why the bloc’s economies have been especially damaged by the closure of borders and restrictions on travels leading to what the International Air Transport Association has dubbed the worst financial crisis in the history of aviation, recording tremendous losses of US$126 billion for 2020 and projected cut of US$47.7 billion in 2021. Member states such as Antigua and Barbuda, Namibia, Australia, Canada and South Africa among others have seen their respective airlines file for bankruptcy and request protection from the catastrophic drop in demand whilst some have been forced to be liquidated entirely with only the most notable international airlines of the bloc surviving after restructuring and gradual spring back of demand. The negative impact on the aviation industry has also caused ripple effects in passenger-based goods trade and air freight services. The services sectors of education, finance and healthcare have been relatively more insulated to COVID-19 shocks after switching services delivery online as compared to the travel, transport, and ICT services sectors, that collectively make up 59 per cent of total intra-bloc services (travel on its own is 30 per cent, above the global average of 21 per cent for the sector) due to the requirement of physical interaction.
A study was conducted of the monthly services exports for 2020 of eight Commonwealth countries, Australia, India, Kenya, Malta, Pakistan, Tanzania, Uganda and the UK, to analyse service trade recovery patterns, the results of which showed staggering drops in services exports of over 60 per cent for Tanzania and Ghana, and 40 per cent for Australia and Kenya, all of which are yet to recover. Meanwhile, by December 2020 the services exports of Malta, India and the UK have rebounded considerably and are continuing on an upward trajectory, and Pakistan has shown a 14 per cent increase in services by the end of 2020. Results showed that countries reliant on services requiring physical presence such as tourism have difficulty recovering, whereas countries specialising in digital services such as ICT fared much better. These results also explain the sharp 70 per cent decrease in services in tourist-heavy Pacific and Caribbean countries.
Commonwealth women in business during COVID-19
Women workers as a demographic have been particularly hard-hit by the pandemic. Throughout the Commonwealth, women make up half of the population and 30 per cent of the labour force. Of these female workers, 43 per cent were employed in services by 2019 (30 per cent in 2000); in developing countries, the share is higher as 90 per cent of the female labour force is employed in services (85 per cent in 2000) whilst 36 per cent of working women in developing countries (16 per cent in 2000) are in the services sector. Yet, compared to their male counterparts they struggle to be adequately represented and are unable to contribute as much to GDP and international trade. Despite 31 member states’ signatures of endorsement on the 2017 Joint Declaration on Trade and Women’s Economic Empowerment, only 1 in 4 individuals involved in tradeable services are women. Furthermore, according to estimates by the International Trade Centre (ITC), only 15 per cent of Commonwealth exporting firms are managed by women and these firms are mainly in sectors such as tourism, travel, retail, food services and entertainment all of which have been particularly affected by the pandemic. The reason women struggle in capitalising on new opportunities is that the majority are involved in the informal sector or housework wherein they are either underpaid or not paid at all. Women that wish to enter the global market and become entrepreneurs face barriers in financing; for example, female-owned SMEs face a US$300 billion credit gap among other problems like cultural, time and skill constraints. Consequently, policy-makers must be subjected to a burden of proof to facilitate and promote female participation in Commonwealth trade and support initiatives like the WTO’s Trade Facilitation Agreement and the ITC’s SheTrades, both of which the Commonwealth Secretariat has both a supporting role in.
Supply mode substitution amidst COVID-19
Services trade is conducted via four supply modes stated under the General Agreement on Trade in Services (GATS):
- Mode 1: Transnational trade supply via post or ICT services including digitally deliverable services (DDS). Accounts for 35 per cent of Commonwealth services exports.
- Mode 2: Services of a state for customers abroad. Accounts for 10 per cent of Commonwealth services exports.
- Mode 3: Business of one country operating in another via international branches and subsidiaries. Accounts for 50 per cent of Commonwealth services exports.
- Mode 4: Movement of individuals of a country to deliver services in another country. Accounts for 4 per cent of Commonwealth services exports.
Modes 2 and 4 have undoubtedly declined due to the requirement of people travelling and being physically present for these modes of services to occur. Mode 2 services such as tourism, healthcare and education declined as virus-prevention measures restricted customer movements, while Mode 4 services fell due to the same travel restrictions being placed on the supplier side. The situation for Mode 3 supplies is more complex; while investment transactions can indeed take place without the parties involved being physically present, it is an important factor for the investors looking to invest large sums of capital to feel secure and sure of their decisions due to which sales for foreign-owned firms in sectors such as hotels and entertainment have been lower. Meanwhile, Mode 1 experienced an upsurge since many trade sectors began conducting their affairs on digital platforms due to the pandemic. However, this transition was relatively smooth only for countries with the appropriate infrastructure, technological capacity, digital connectivity, and skilled labour which is not the case for several developing countries and LDCs.
LDC Trade Performance and the Istanbul Programme of Action (IPOA)
Before the onslaught of the pandemic, the LDCs’ economies were already in a vulnerable state due to the pre-COVID factors mentioned in sections 1.1 and 1.2, due to which they were some of the most devastated due to the drastic drop in external demand for goods and services, lowering of key exports’ prices, and waning investment flows. The LDCs’ lack of trade facility infrastructure limits their production capabilities due to which they have not been able to diversify their trade products enough to safeguard their economies from shocks like the global recession and the COVID pandemic. The struggle of all 47 LDCs across the globe to catch up to world averages in development was already apparent before the pandemic as they were not on track to meet the goal of the UN Sustainable Development Goals (SDGs)-supported Istanbul Programme of Action (IPOA) which was to double the global export shares of the LDCs from 1 per cent to 2 per cent. The dearth of trade growth paired with the ongoing financial crises risks slowing, if not reversing, the Commonwealth LDCs’ progress and may delay their graduation from the LDC category. Currently, 12 of the 14 Commonwealth LDCs are predicted to elevate out of the category in the coming 4 years.
Figure 6: Trade Performance of LDCs During Istanbul Programme of Action
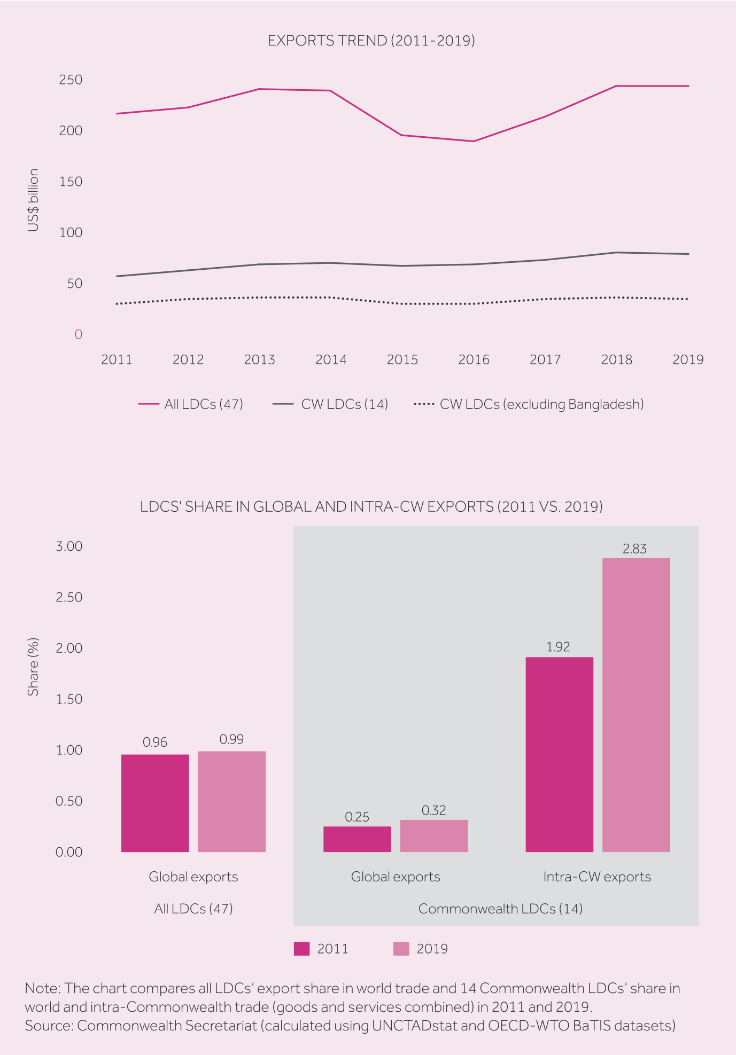
Compared to global LDCs’ (47 in total) performance which stagnated between 2011 and 2019 with a 0.03 per cent increase in the share of global exports, the Commonwealth LDCs recorded a 0.07 per cent increase in the share of global exports as their export value rose from US$56 billion to US$79 billion, a US$23 billion increase while global LDC exports value grew by US$28 billion in the same duration. The Commonwealth advantage is a significant factor in the Commonwealth LDC’s outstanding performance compared to global trends as their share in intra-bloc trade was 1.92 per cent, double the share of all LDCs in global trade [Figure 6]. Bangladesh’s performance within the bloc’s LDCs should also be highlighted as a significant contributor to LDC export shares, growing in value from US$26 billion in 2011 to US$45 billion in 2019.
Commonwealth Trade forecast for 2022 and beyond
In 2015, the Commonwealth Secretariat had predicted the value of intra-Commonwealth trade to surpass US$700 billion by 2020 however pre-pandemic factors had rendered this benchmark unfeasible even before the start of COVID-19. Despite the obstacles, intra-bloc exports are anticipated to regain 2019 levels by the end of 2021 and surpass the US$700 billion mark by 2022. Global Commonwealth exports estimates are more optimistic, surpassing the pre-pandemic 2019 estimate of US$3.73 trillion and increasing to US$3.76 trillion by the end of 2021. Provided that the post-global financial crisis long-term Commonwealth growth rate of 5 per cent remains steady the bloc’s global trade value will stay on the path to exceed US$6 trillion by 2030. However, it cannot be stressed enough that to achieve these economic recovery goals it is pertinent that sustainable and equitable policy revisions be implemented. Economic recovery is contingent on equal distribution of vaccines across all Commonwealth states. Judging by the current rate of vaccine rollouts, some member states may see their entire populations be fully vaccinated by 2023 or 2024, with the Asian countries rebounding the quickest due to their lead in vaccination rates while LDCs lag as they struggle to collect an adequate supply of doses.
Almost 60 per cent of the Commonwealth’s population is below the age of 25 meaning that the Commonwealth workforce is more tech-savvy and capable of leading the way for economic digitalisation via tech start-ups and innovation of useful cyber tools and programmes, especially now that economies and governments worldwide have become better accustomed to virus containment measures and have implemented appropriate policies to streamline trade activity and reduce public fear of the virus during the second and third waves of lockdowns. Improvements are evident in shipping demand, consumer spending, domestic travel and commodity prices but this is more so for merchandise trade than services, the latter of which, unlike the global crisis of 2008, has been the most affected aspect of trade due to physical restrictions and stoppage of travel. While the redirection of services supply to Mode 1 has helped cushion the economic devastation, it has not fully compensated for the loss in services sectors such as tourism, travel, hospitality, entertainment and transportation. Remaining optimistic of intra-Commonwealth trade flow resilience that has withstood the economic crises of 2008/2009 and 2015/2016 while being hyper-aware of, and actively improving upon, the existing trade gaps is the goal for all Commonwealth states to overcoming the pandemic together.
Published on the 14 July 2021, the Commonwealth Trade Review 2021 is the third instalment of the Commonwealth Secretariat’s trade evaluation series that began in 2015. The Trade Review of 2021 investigates the impact of the COVID-19 pandemic on global and intra-Commonwealth trade performance, investment levels, and outlook on economic recovery in the short and long term. It also offers policy revisions, infrastructural changes and guidelines for policy-makers and businesses with a special focus on utilising digital technologies in trade to ensure post-pandemic recovery is robust and inclusive so it may be durable in the face of future challenges.
This trade review was written by members of the Commonwealth Secretariat Brendan Vickers, Adviser and Head of Section in the International Trade Policy Section; Salamat Ali, Senior Trade Associate of the Trade Division; Neil Balchin, Economic Adviser of Trade Policy Analysis; Collin Zhuawu, International Trade Consultant of Trade Policy Analysis; Kim Kampel, Trade Adviser at the Commonwealth Small States Office; and Kimonique Powell and Hilary Enos-Edu, Research Officers at the International Trade Section.
The Trade Review includes honourable mentions of fellow Commonwealth Secretariat members Paul Kautoke; Senior Director of Trade of the Oceans and Natural Resources; Kirk Haywood, Head of the Commonwealth Connectivity Agenda; Benjamin Kwasi Addom, Adviser at the Agriculture and Fisheries Trade Policy division; Vashti Maharaj, Adviser at the Digital Trade Policy division; Niels Strazdins, Trade Specialist; Tanvi Sinha and Radika Kumar, Trade Advisers. The Trade Review also gives thanks to Nick Ashton-Hart, Special Adviser at ICC United, UK and the United Nations Conference on Trade and Development (UNCTAD).
The Trade Review utilised data from three background papers funded by the Government of the United Kingdom for the Overseas Development Institute (ODI). These papers were written by Sangeeta Khorana and Hubert Escaith, Ben Shepherd and Anirudh Shingal, and Karishma Banga and Sherillyn Raga.
This newsletter is Part 1 of 5, each analysing separate topics discussed within the Trade Review.
For direct access to the Trade Review document please click here.